Why anyone needs this
Large parts of the world have no usable map. That tends to correlate with exactly the places where a map matters most — disaster response, public health outreach, getting aid down a road that may or may not exist.
Volunteers at the Humanitarian OpenStreetMap Team fill those gaps by tracing roads by hand from satellite imagery. It works, and it is enormously slow.
HOT’s answer is a platform called fAIr. Their own description is the part worth reading twice: it’s meant to be the connective tissue between the people who build geospatial ML models and the mapping communities who need them — “without requiring users to be AI/ML engineers.” Models get built in labs; the communities mapping their own neighbourhoods have no practical route to using them. And without those communities’ feedback, the models never improve where they’re most needed.
What it has to be good at
Give this model a satellite tile and it draws the roads it finds, labelling each one paved or unpaved. A person still checks and corrects it. The job is turning a blank map into a draft.
It’s a base model — a starting point that a mapping community fine-tunes on imagery of their own region. So the thing it has to be good at is adapting. A district in Nepal doesn’t look like Las Vegas, and the model that helps there is the one that picks up local conventions quickly from a small amount of local data.
Which means the value gets created at a step I don’t control, by someone I’ll never meet. That shaped what I built and how I measured it.
Under the hood it’s a vision transformer Meta released, with a segmentation head I trained on satellite road labels. The model card has the specifics.
The timeline
-
Asked before building
16 Sept 2026I sent HOT four questions before writing any code. Should a first model do multi-class surface types or plain binary road detection? Does their interface expect road lines or filled shapes? Two of the answers changed the design, and one of them — that they’d prefer multi-class but doubted there was enough training data — turned out to predict the exact wall I hit later.
-
Built a base model on one city
Khartoum first, from a public satellite road dataset. One city, so that everything after it had something to be compared against.
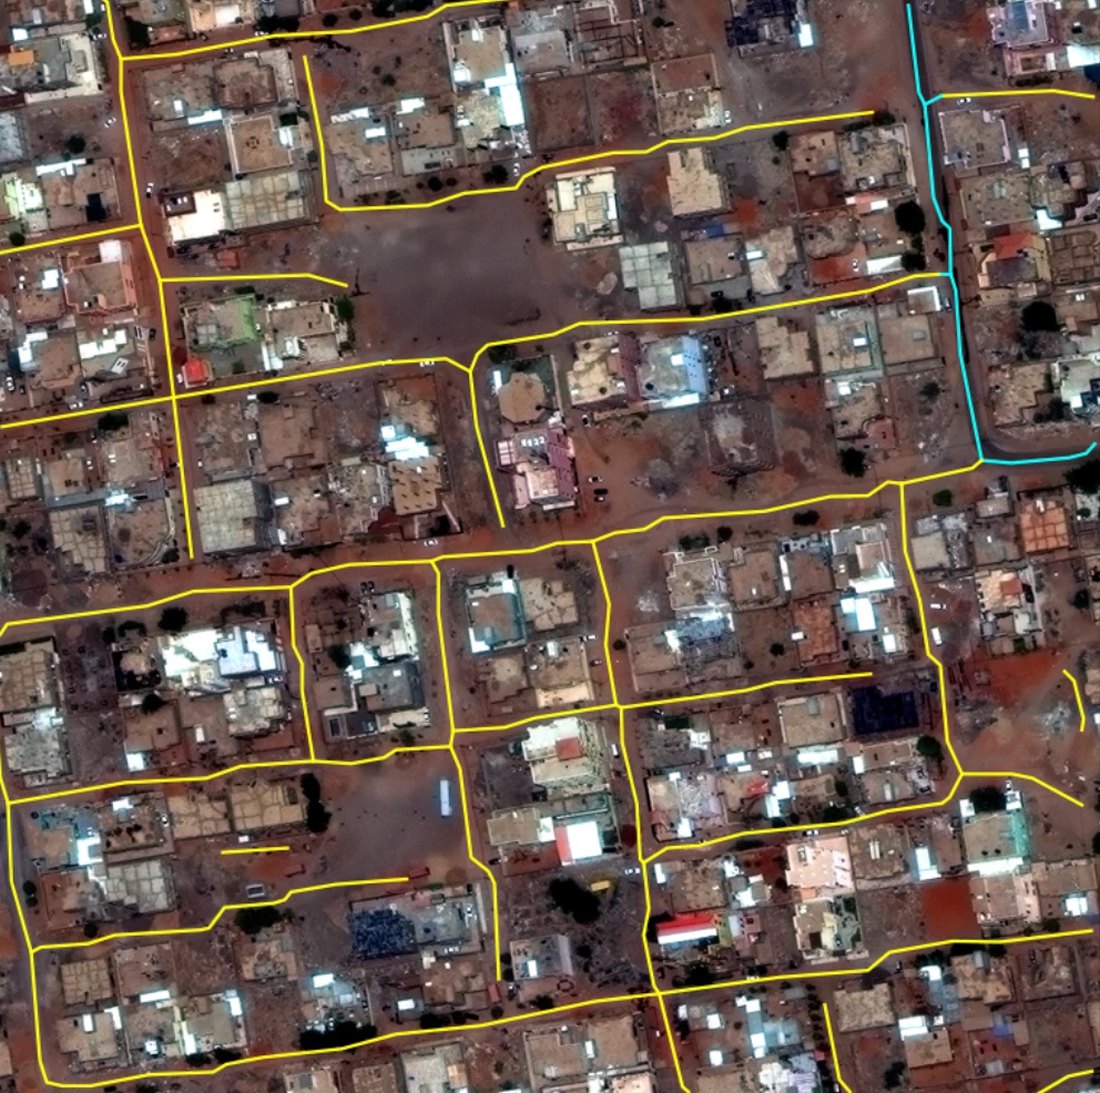
The one-city model over a Khartoum tile: 50 road segments across 25 image tiles, 44 of them unpaved track. This tile was part of what the model learned from, so it shows what it draws — not how it does somewhere new. Imagery: SpaceNet 3, CC BY-SA 4.0. -
Found a class that couldn't exist
The model has three labels for road surface, and one of them — footpath — it can never produce.
That’s a property of the training data. I checked every road in the dataset: 56,251 of them, and none of its road types is a footpath. It’s a dataset of vehicle roads.
So the model was being graded on a category that could not appear, quietly capping its best possible surface score at two-thirds. I switched that label off and changed the scoring to name the categories it has no evidence for instead of averaging in zeros.
I’d also reported a footpath accuracy figure earlier. When I went to reproduce it, it came out at zero, and I withdrew it before the proposal went out. It had only ever existed in prose — never written to a saved measurement — which is exactly why it survived as long as it did.
-
Checked the ruler before blaming the model
Roads are only useful if they join up. Alongside the obvious score — how much of the road surface the model got right, pixel by pixel — I tracked a second one: do the roads it draws form a network you could actually trace a route across?
On the one-city model that second score came out low, and I couldn’t tell whether that meant the model was bad or the scoring was.
The tempting response is to adjust settings until the number improves. I tried 53 combinations of the settings that turn a prediction into road lines. The best of them barely moved it.
So I checked the ruler. I took the reference map — the one drawn by hand, the thing the model is compared against — and fed it through the same scoring machinery as if a model had produced it. It scored about 0.79 out of a possible 1.0.
That settled it. A good answer does score well, so the scoring works. The model was genuinely the weaker part, and specifically because its roads came out in pieces. It also gave me a yardstick I hadn’t had: 0.79 is what a near-perfect answer scores on this scale. Not a number I picked — a number I measured.
Two things worth keeping honest: the settings were chosen using the same data they were then scored against, so even the best figure flatters itself; and the setting I picked made the worst area worse, because the selection rule chased the average and the weakest case paid for it.
-
Retrained on four cities
Four cities instead of one, same recipe. I kept the first city’s test split frozen so that a before-and-after would actually mean something.
-
Two ways of scoring disagreed
I scored the new model against the old one on that frozen test data. The two measures told different stories.
The pixel score barely moved. The connectivity score — the one I’d checked the ruler on — went up by about 38%.
That gap is the interesting part. A mapper doesn’t need pixels, they need roads that connect — and a map that’s mostly accurate but broken into disconnected fragments is far less useful than the first score makes it sound.
Both scores come from four areas of the city — a fifth had no roads in it to score against — measured against one organisation’s hand-drawn maps. So what they capture is agreement with those maps, not correctness, and it rests on four areas rather than a city.
Even after that jump it scores about half what the hand-drawn map does. Better connected, not well connected.
And I can’t say why it improved. The four-city model also trained for longer, and it ran once with no noise floor measured — so more cities, more training and run-to-run variation are still tangled together.
-
Rehearsed the real use case
This is the test that actually matters, for the reason at the top: a base model earns its place by how well it adapts somewhere new.
So I fine-tuned it onto two towns it had never seen — Banepa in Nepal and Nhamatanda in Mozambique, real imagery against community-drawn maps, nothing like the benchmark cities — with the rules for what would count as an improvement written down before I looked. It did better on both, and cleared the bar I’d set in advance.
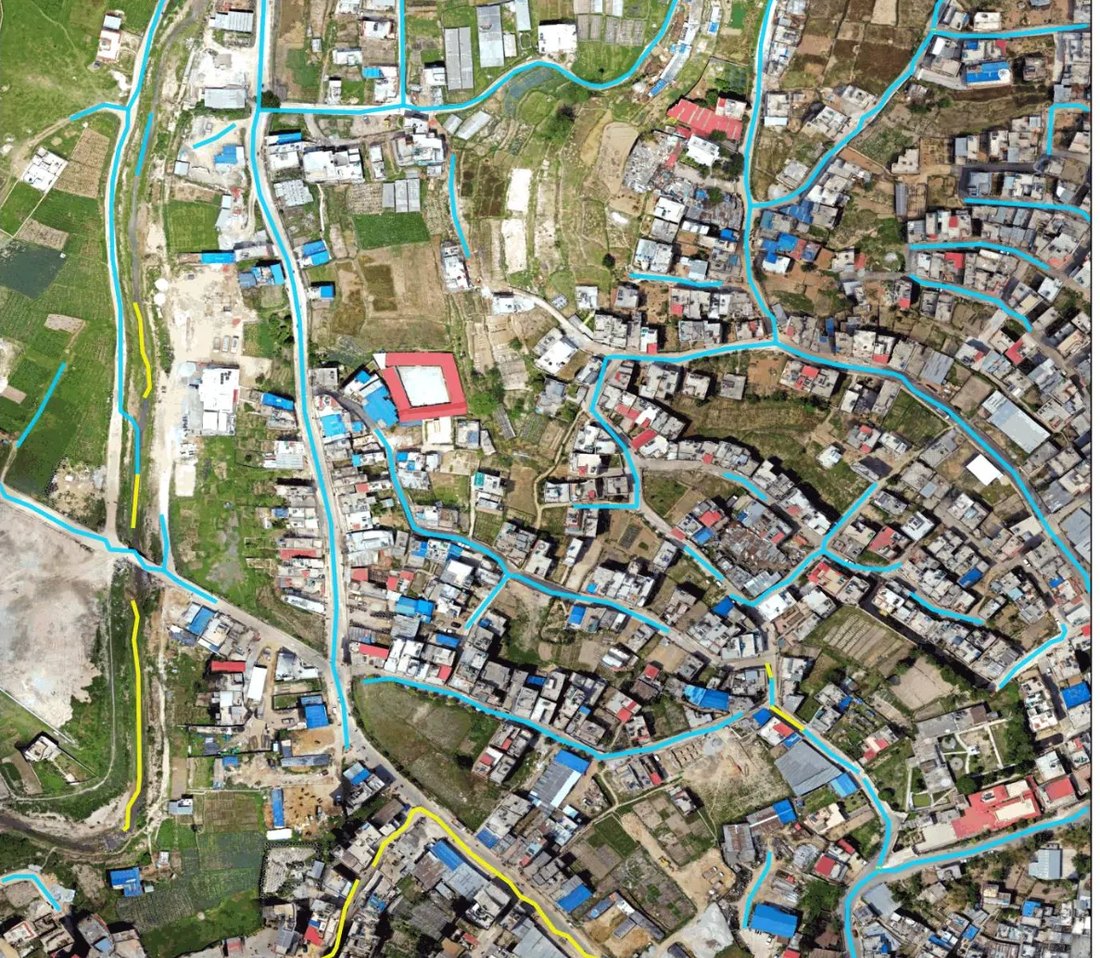
The same one-city model on Banepa, Nepal: drone imagery at roughly 3 cm per pixel that it had never seen, with no fine-tuning of any kind, finding 55 road segments. This is the starting point a mapping community would fine-tune from. Imagery: Geomatics Engineering Society via OpenAerialMap, CC BY 4.0. Then I used those results to decide which version to ship, and that decision spent them. Once you’ve chosen something because of how it scored on a test, that test isn’t an independent check any more — it’s part of how the thing was built. So I wrote that into the project’s records:
Outcome inspected, so this region is development data. It cannot serve as confirmation for any Stage B claim […]
Two towns, permanently retired as evidence, written down voluntarily. The same record notes those towns were scored against raw community-contributed maps, never hand-checked — so agreement with them is agreement, not correctness.
Nothing forces this bookkeeping. It only ever costs you something.
-
Published the model for anyone to download
The model itself is published, not just an API you call: the trained file is on HuggingFace with the record of how it was measured beside it. Download it, run it, check the claims. The code that trained it stays private.
By this point the project was more than a model: a training pipeline, 1,189 tests, a packaged version that runs on an ordinary server with no graphics card, the work to make it plug into HOT’s platform, and a pipeline that pulled and prepared twenty thousand satellite tiles across five regions. Every number in its documentation says what kind of number it is.
-
Proposal submitted
22 Sept 2026 I am hereSent to HOT’s open call for geospatial models. No response yet.
-
Acceptance, and a grant agreement
The call runs as a grant. Acceptance isn’t a finish line — it’s the document that lets the integration work start.
-
A pull request into HOT's model repository
I hand over a description of the model and two container images: one that trains, one that serves predictions. A HOT admin reviews it. I never touch a server — my entire deliverable is a container that behaves correctly when somebody else runs it.
-
Merged, and the model goes live in fAIr
Their system reads the description, mirrors the weights, and stands the serving image up as a live endpoint. The grant releases on merge, not on acceptance. A model on a download page is a research artifact; a model merged into fAIr is one people can actually reach.
-
Mappers fine-tune it for their own districts
A mapper opens fAIr and, where today they can only choose Buildings, they can choose Roads. The generic model won’t know their district’s conventions — an unpaved track in rural Mozambique doesn’t look like one outside Las Vegas — so they draw their area, and the platform pulls existing map data and imagery for it and fine-tunes my model into their model. They write no code and don’t need to know what fine-tuning is.
-
Predictions become map data
When a mapper trusts a prediction, they accept it and it goes into OpenStreetMap as a real edit. A road that wasn’t on the map is now on the map, somewhere someone is trying to route aid down it.
This is the only step that counts. Everything above it is plumbing in service of it.
How this was built
I direct AI agents to write the code. My own time goes to deciding what to build and to building the checks that catch the agents when they get it wrong, which is most of the engineering.
Some of what that looks like here:
- A figure has to exist as a saved measurement, not just in prose. The footpath number earlier failed that check and was withdrawn.
- Before the proposal went out, every figure in it was audited against those saved measurements. Anything without one was cut, including a results table I’d have been glad to publish.
- Documents go to reviewers running on different models from the one that wrote them, read-only, so a reviewer can’t quietly fix what it finds.
One of those reviews looked at a revision rather than an original, and found seven new mistakes the rewrite had introduced. Revising turns out to be about as error-prone as writing, which isn’t obvious until you count.
What I’d do differently
I built a rule-based system to detect when the satellite imagery and the map were misaligned. It accepted 2 tiles out of 200 — and when I looked at those two, both were wrong. The maps had been traced from the same imagery, so they were already aligned.
Writing the rules down in advance was right. The thing I wrote rules for didn’t need solving. Look at the pictures before building the machinery.